Click Here to View This Page on Production Frontend
Click Here to Export Node Content
Click Here to View Printer-Friendly Version (Raw Backend)
Note: front-end display has links to styled print versions.
Content Node ID: 392417
It was frigid and snowing heavily at Chicago’s Midway Airport on Dec. 8, 2005. Runway 13C was out of action with a runway visual range (RVR) of just 4,500 feet—below minimums. So, like other flights before it, Southwest Flight 1248 made its approach to Runway 31C, despite an 11-knot tailwind. The aircraft touched down normally, but the crew did not initiate reverse thrust until 18 seconds later, with just 1,000 feet of runway left, according to the cockpit data recorder
SWA 1248 didn’t stop. Instead, it ran off the departure end of the runway, through a fence and onto Central Avenue just south of 55th Street, striking two cars. Inside one of them, six-year-old Joshua Woods was killed. A dozen people were hurt.
That accident, in which a slippery runway figured prominently, was the genesis of the TALPA initiative—for takeoff and landing performance assessment—as an effort to stem the growing problem of runway excursions.
FAA Demands Action
As a result of the 2005 overrun at Midway, the FAA issued Safety Alert for Operators (SAFO) 06012, urgently recommending operators of turbojet airplanes develop procedures for flight crews to assess landing performance based on conditions actually existing at the time of arrival, as distinct from conditions presumed at the time of dispatch.
“They wrote that SAFO and expected everybody to follow it,” said Chet Collett, director of flight operations engineering at Alaska Airlines. “And all the airlines said, ‘There’s no way we can comply with that SAFO. The data is just not there.’”
So the FAA called a summit of aircraft operators in July 2006. Collett was there, as were his counterparts from several other airlines. Collett said an FAA safety inspector told the assembly that any time braking action on a particular runway was reported as “less than good,” arriving pilots were to perform a pre-landing assessment.
“And I raised my hand,” said Collett. “I asked, ‘How is a pilot going to know that the braking action is less than good when the current ATC regulations say that braking action advisories don’t go into effect until braking action is reported as less than fair?’”
The room became silent, Collett said. The first day of the summit adjourned without resolution.
The Cocker Spaniel Test
Assessing the condition of a runway covered with water, snow, slush, or ice has been a difficult issue for airport operators ever since the first runways were built. Braking action reports from pilots were considered subjective, depending on the pilot’s skill, as well as the aircraft type, weight, landing speed, and a host of other factors. Airport operators initially had few choices when it came to figuring out how to tell arriving pilots what to expect when they touched down on the runway surface.
One was unique in its innovation—if not questionable in its treatment of animals. “The ARC’s Airport Working Group called it the cocker spaniel test,” said Collett. The idea: the airport operator would jump into the cab of a truck, put a dog in the passenger seat, drive down the runway, then hit the brakes.
“If the dog remained on the seat, braking action was poor to nil,” Collett said. “If the dog stumbled, but remained on the seat, braking action was deemed fair. If the cocker spaniel fell onto the floor, then braking action was pretty good.”
Perhaps not the most scientific method.
Eventually, braking action was reported in terms of “Mu” value—the co-efficient of friction between the runway and an aircraft’s tire. The aviation industry developed Mu meters, small trailers that could be attached to airport vehicles and driven down the runway to objectively measure braking ability.
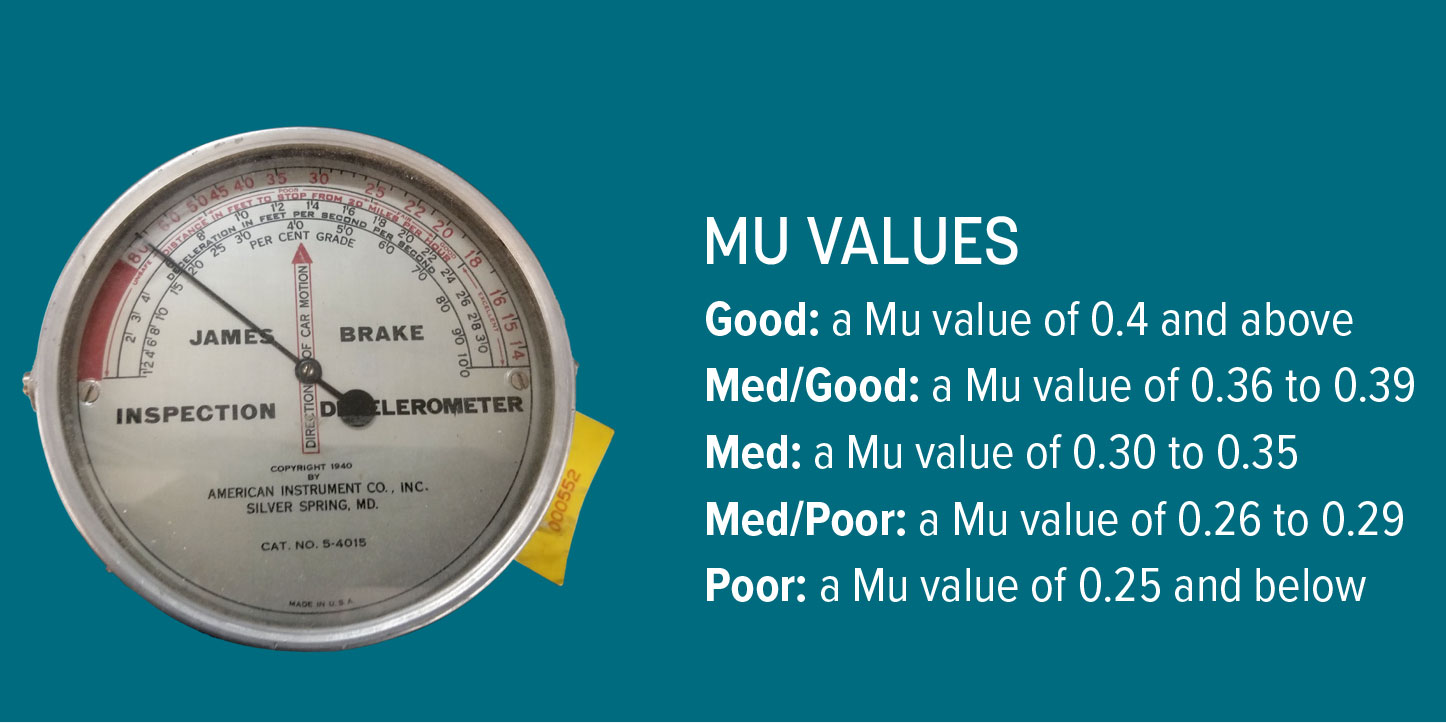
But FAA officials frequently pointed out the lack of direct correlation between Mu values and airplane runway performance.
“That was the FAA’s biggest argument,” Collett recalled. The agency insisted there is “no direct correlation between Mu that is measured by a Mu meter and the airplane’s performance on a runway.”
Another issue was the difference between the various Mu meters themselves. “If they’re not traceable to a single standard,” said Rich Boll, a member of the NBAA Access Committee, which has developed an extensive presentation on TALPA, “then they can yield different results. For example, one machine might read a certain Mu value whereas another machine running right next to it on the same runway provides a different value.”
In the end, the FAA and industry experts agreed that Mu values do still have a place in the runway assessment process—determining, upgrading, or downgrading reported conditions. But they also agreed that Mu values would never be reported to flight crews. Instead, they would be used by airport operators to assess runway-braking action.
There was another problem. Data created by airplane manufacturers to calculate braking performance was remarkably varied and often not representative of real-world practices and conditions.
“I would say it was kind of like the Wild West,” said Mike Byham, Collett’s counterpart at American Airlines. Like Collett, Byham worked on TALPA from the beginning. “The manufacturers could pretty much produce whatever it was they felt appropriate or, in some cases, what was competitively necessary.”
Byham, Collett, and other industry experts summoned to Washington, D.C., for that two-day summit in July 2006 took their deliberations to a hotel bar after the first day’s meeting. And, as has often been the case when major advances in aviation are concerned, that’s where they made a significant breakthrough.
“We literally wrote out the first draft of the RCAM [Runway Condition Assessment Matrix] on a cocktail napkin,” said Collett.
The next day, Collett, Byham, and the others presented their cocktail napkin to FAA officials. They were immediately designated members of the TALPA Advisory and Rulemaking Committee (ARC).
Top-of-descent Decision-making
During the nine-year long process of creating the TALPA initiative, the FAA also engaged in an effort to standardize runway performance data created by aircraft manufacturers. In December 2015, the agency issued two Advisory Circulars—AC 25-31 and AC 25-32—to that effect, choosing to make the process of developing data related to takeoff and landing on contaminated runways voluntary, despite the TALPA ARC’s recommendation that the standards be made mandatory. Those two ACs are relatively new and manufacturers are still reacting to them. In addition, flight crews operating older airplanes that no longer have manufacturer support might have no source for such data.
“Better data that makes more sense was something we deemed a ‘must-have,’” said Byham. “So there were changes made to how the landing data were actually calculated to make them more realistic.”
For one thing, Byham explained, the way manufacturers calculate air distance over the landing threshold has been changed to make it more applicable to the way line pilots actually fly.
“What we found…was that the average pilot would take about seven seconds from the threshold to touchdown. So there was a seven-second requirement put in the development of the data. That was crucial in terms of making this work in the real world,” he said.
Along with more accurate data from manufacturers, members of the TALPA ARC developed a landing-distance factors table to accompany RwyCC reports to pilots.
FAA Order 8900.1 advises flight crews to multiply the dry, unfactored landing distance data published in the aircraft flight manual (AFM) by the values presented in the landing distance factors table.
For example, suppose the dry, unfactored landing distance of a Cessna Citation X is 3,330 feet. Under the landing distance factors table, a RwyCC of 3 and using reverse thrust, the flight crew would multiply that 3,330 feet by 2.5. The resulting runway length requirement comes out to 8,325 feet, a number that includes a 15-percent safety margin.
Under the TALPA initiative, the flight crew performs this calculation as part the time-of-landing assessment at the top of descent.
“I believe condition of the runway should be assessed as late as practicable before landing,” Byham said. That, however, presented the ARC with concerns about how data obtained by the flight crew at the top of descent might conflict with dispatch data.
Byham said the resolution came in the amount of fuel aircraft are required to carry in situations where destination runways are contaminated and conditions are bound to change.
“We decided that, if you find yourself in that kind of situation, make sure you carry enough fuel to take you to an alternative airport where the landing distance requirements can be met,” he said. “I thought that was a pretty good, commonsense way of approaching it.”
Mu Values Redeemed, Upgrades Possible
Even after the TALPA system was fairly evolved, Collet still wasn’t satisfied. While airport operators could downgrade the RwyCC, the FAA left no mechanism in place to upgrade the reported runway condition. His airline operates all over Alaska. Runways covered with ice are often the norm during winter. But because of the subzero temperatures, that ice, sometimes mixed with sand, often provides braking action comparable to runways deemed to be in much better condition. Without some modification to the rules surrounding contaminated runways, many airports in Alaska—lifelines to the communities they serve—would be forced to close for much of the winter.
On the last day of the ARC meeting Collett volunteered Alaska Airlines to provide the FAA with test data on seven airports in Alaska. A representative of Pinnacle Airlines volunteered to do the same at Minneapolis-St. Paul and Traverse City, Michigan, both airports also participants in the ARC.
“All of a sudden, the FAA had willing volunteers from the industry and the airports. They couldn’t pass it up,” he remembered. “Our motivation was to prove to the FAA through hard data that, in fact, it was safe and appropriate to be able to upgrade runways that were deemed by the RwyCC as 0 or 1.”
Between 2009 and 2010, Collett and members of an FAA-appointed team monitored more than 6,000 total landings, correlating their findings with information gathered by airport operators.
“Where ice was present and runways would have been assigned a RwyCC of 0 or 1, but showed high Mu values, more than 75-percent of the time, they reported good braking action. The FAA couldn’t argue with that data.”
Based on their findings, the FAA now allows airport operators to raise the RwyCC on some ice-covered runways from 1 to no higher than 3, based on observations that include Mu readings.
What about Takeoff?
Much of the TALPA Initiative concerns landing assessment. But, as Collett pointed out, the “T” in TALPA stands for “takeoff.”
“Many people both at the airports and among the pilots look at the RCAM and say, ‘Why are we concerned about contaminant depths greater than an eighth of an inch? The answer, of course, is because of takeoff.”
In assessing takeoff performance, braking is a crucial issue. Flight crews need to know how the aircraft will perform if they have to abort. But the depth of contaminants beyond one-eighth inch is important because of the effect they can have by slowing down the aircraft’s ability to accelerate—impingement drag.
“You have to be concerned not only about stopping performance, but also about the ability of the aircraft to continue and accelerate through that crap on the runway and be able to rotate and get airborne within the confines of the runway,” he explained. “If there’s a half-inch of wet snow or slush on the runway, you have to take a pretty severe takeoff weight penalty to ensure you have the ability to accelerate and get out of that stuff in the event of an engine failure.”
Work in Progress
Although the TALPA initiative went live in 2016, it is very much a work in progress, say both Collett and Byham. For one thing, Byham said, runway condition reporting needs to be improved across the board.
“It would seem that, indeed, the airports do have the tougher end of the whole thing,” he said. “You can’t just say that braking advisories are in effect. You’ve really got to give some solid information, and a lot of flight crews in my experience seem to feel that’s a difficult task—to draw that out of the airport.”
Another issue Byham hopes to improve is the subjective nature of pilot-braking reports. “I’m hoping we can reduce the subjectivity on those braking-action reports or eliminate it through some type of automation,” he added.
Collett wants to see changes in the RCAM format, making it easier to read.
“The way it’s presented, in a vertical format, the airport, the pilot and the dispatcher have to have it all memorized to know where to look,” he said. Right now, the FAA displays the RCAM in a vertical format. Under Collett’s direction, the Alaska Airlines version of the RCAM is presented in a horizontal format he believes is simply easier to decipher.
Still, Byham said, the RCAM is certainly a worthy feat. “I’m proud of the way the performance engineering community has come to together on this,” he said. “It really is a noble endeavor.”
Finding A Common Language
The TALPA Initiative seeks to standardize the way field conditions are assessed by airport operators and conveyed to flight crews. The RCAM defines these contaminants. The runway condition codes (RwyCC) classify the effects those contaminants have on braking action. The observed contaminants are reported to the FAA through the Notam system. The FAA, in turn, uses that data to generate a field condition (FICON) report to flight crews.
For reporting purposes, the runway is divided into thirds. Each third is assigned a code of between 0 and 6.
• 6 Dry runway.
• 5 Runway is wet or covered to some degree by frost, as well as runway portions contaminated by one-eighth inch (3 mm) or less of slush, dry snow or wet snow.
• 4 The outside air temperature is 5 deg F (-15 deg C) or less and there is compacted snow on a portion of the runway.
• 3 Wet runways described as slippery, as well as runways contaminated with dry or wet snow of any depth on top of compacted snow. Also, runways with more than one-eighth inch of dry or wet snow or runway portions covered with compacted snow when temperatures exceed 5 deg F (-15 deg C).
• 2 Runway portions covered with water or slush at any depth greater than one-eighth of an inch.
• 1 Runway portions covered with ice.
• 0 Runway portions covered by wet ice, slush over ice, water over compacted snow, as well as those covered with dry or wet snow over ice. Under the TALPA initiative, these runways are unsafe and must be closed until their conditions are improved.
Listen to the podcast.